Categories
DH Pedagogy

TimelineJS & the British Reformations

Students in a British history course recently completed an extensive timeline of the British Reformations in context. Professor Michelle Brock structured the project as an assignment that amounted to 15% of the course grade. The timeline also serves as a resource for students writing their final essays for the course. This approach to DH emphasizes that digital projects are not simply end products but also can inform written works.
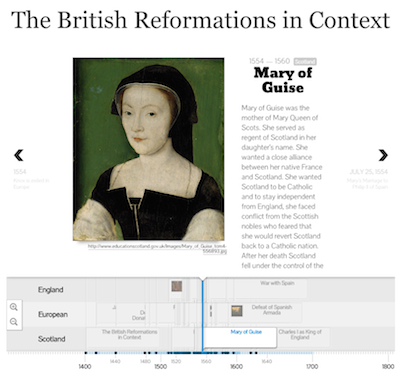
Screenshot of British Reformations in Context timeline

TimelineJS was chosen by Brock as the appropriate tool for this project due to its visual capabilities. Prior to the beginning of the term, Brock consulted with the DHAT to plan how to instruct students on using this tool to contextualize the British Reformations. An essential feature was the tag functionality of TimelineJS to indicate whether an event occured in the English Reformation, Scottish Reformation, or the Continental European Reformation. Brock describes the goal of the assignment:

“The goal of this three-tiered timeline is to give student a visual overview of the trajectory of the European, English, and Scottish Reformations, and a more tangible representation of the relationship between the three. This should also provide a deeper understanding of the English and Scottish Reformations in their European contexts, as well as an illustration of their respective local and national dimensions. Students will then use this timeline to help write their final essay.”

Students worked in three groups of four to populate the spreadsheet that powers the timeline. Students were responsible for identifying and entering key events, documents, and people for their respective Reformation (a period spanning between 1450 – 1650). Each entry had to include a brief descriptive paragraph (80 – 120 words) explaining the significance of the topic. Students were encouraged to include images where appropriate. And, if applicable, students could include links to video on YouTube.

Each member of the group was expected to contribute 7 – 10 entries. Groups were expected to work collaboratively over the course of the semester. A librarian provided initial training to the class on January 19. The students completed their work on March 30. In addition, all the students had to turn in an individual timeline report that specified which entries they wrote and the list of sources used to write those entries.

The final timeline has 73 entries about the Reformations.

Interested in using TimelineJS in your couse? See our introduction to TimelineJS.

Categories
Event on campus Speaker Series

Gabriel Dance to Speak on Friday, 3/20/2015

In the next digital humanities workshop we will hear from Gabriel Dance, a journalist and editor working at the cutting edge of news. Based in New York City, Gabriel helped launch the Guardian US, building a graphics team that garnered awards and recognition for interactive storytelling. He was part of a group of journalists who won the 2014 Pulitzer Prize for Public Service for coverage of widespread secret surveillance by the National Security Agency. His work has also won two Emmy awards for New Approaches to News and Documentary, an Alfred L. DuPont award, a World Press Photo award, and several others. Gabriel is currently a managing editor at The Marshall Project, a non-profit investigative journalism startup focusing on crime and punishment in the United States. Check out: http://www.theguardian.com/world/interactive/2013/nov/01/snowden-nsa-files-surveillance-revelations-decoded. The luncheon is at 12:15 on Friday, March 20, 2015 in the IQ Center; you can sign up at http://go.wlu.edu/dhworkshops.

Categories
Event on campus

DH Presentations at SSA

Don’t miss the upcoming presentations about Digital Humanities projects at SSA on Friday, March 13.

9:30-10:45 Panel Presentations 1
* Literary Digital Humanities: Hotel Orient
Location: Reid 111

2:30-3:45 Panel Presentations 2
* Historical and Cultural Digital Humanities
Location: Science Center G14

* Literary Digital Humanities
Location: Science Center P307

Categories
Event on campus Speaker Series

DH workshop on DH Studio: Scholarly Text Encoding

Feb19DHworkshop-copy

Please join us for the next Digital Humanities workshop on Thursday, February 19, 12:15-1:15 pm in the IQ Center.  Mackenzie Brooks, Jeff Barry, and Steve McCormick will speak about the pilot DH studio course Scholarly Text Encoding and its co-requisite course French 341.  This session will provide an overview of the DH Studio concept, describe the structure of the Scholarly Text Encoding course, and explain how it integrates with the advanced French course and a grant project. To register go to http://go.wlu.edu/dhworkshops

Categories
Incentive Grants

Two DH Incentive Grants Awarded

Congratulations to Christa Bowden and Genelle Gertz!  They are the latest recipients of W&L Digital Humanities Incentive Grants.  Professor Bowden’s students in her Spring Term Abroad class, ARTS 223 Photography and the City of Paris, will create their final project portfolios as e-books, which will be the first time in W&L’s photography program that a major course project has involved digital photographs rather than physical prints.  Each e-book will consist of a body of photographs based around a Paris-based concept or theme outside the realm of traditional tourist photography.  In her Winter 2015 course, ENGL 330 Gaming in Milton’s Paradise Lost,  Professor Gertz will use the Ivanhoe gaming platform, developed at UVA’s Scholars’ Lab, to afford her students a unique approach to this often analyzed work.

Categories
Event off campus

Institute for Liberal Arts Digital Scholarship to be held at Hamilton College in Clinton, New York this summer

From July 26 to August 2, 2015 a partnership of 23 liberal arts institutions will host ILiADS, the Institute for Liberal Arts Digital Scholarship, at Hamilton College in Clinton, New York.  The institute will have both a team and project-based approach as well as a more traditional conference structure.  See http://iliads.org/ for more information.

Washington and Lee University is organizing a group to attend this institute.  Please contact Paul Youngman (youngmanp [at] wlu.edu) if you are interested in being a part of this group.


Categories
Announcement

Digital Humanities Incentive Grant – call for proposals

Submit your course proposals for a Digital Humanities Incentive grant of $1000 to dhat@wlu.edu by 5 pm, 31 October 2014.

Two grants of $1000 will be awarded for pedagogical projects employing tools and techniques of digital humanities within winter or spring 2015 courses. For samples of such course-based projects, please see http://dhat.wludci.info/projects/courses/

Competitive proposals will integrate computing tools such as visualization techniques, data mining, computational analysis, digitized annotated editions of texts, or crowd-sourced interpretations, but you don’t need to know the tools right now, just the project you’d like to embark upon. Preference will be given to plausible projects that will reach all students in your course: tell us about how you think you’d evaluate their work, according to our student learning outcomes. How will your DH project help students meet course, program, or FDR learning objectives?

The DHAT (Digital Humanities Action Team) members are ready to assist course-based DH projects, large and small. If you have a course project you’d like to add to our blog, write to DHAT@wlu.edu .

All undergraduate faculty teaching winter or spring courses employing DH pedgogy are eligible to apply.

Categories
DH Incentive Grants Pedagogy Project Update Tools

Raw Density & early Islamic law

Professor Joel Blecher received a DH Incentive grant from W&L for the course History of Islamic Civilization I: Origins to 1500. A pedagogical DH component of that course is for students to produce a set of visualizations of data that they have collected about the transmission of early Islamic law. The students will be using two tools for the visualizations: Palladio and Raw Density.

In this post we’ll examine the use of Raw Density. Separate posts will explore the use of Palladio and the data collection process. This post will provide one example of a data visualization of early Islamic law.

 Raw Density

Raw Density is a Web app offering a simple way to generate visualizations from tabular data, e.g., spreadsheets or delimiter-separated values. Getting started with Raw is deceptively simple: just upload your data.

The complicated part is deciding which of the sixteen visuals is best for your data. While an entire course could be taught on data visualizations, the purpose within this course is for the students to develop familiarity with visualizing historical data. Not all types of charts are appropriate for every type of data.

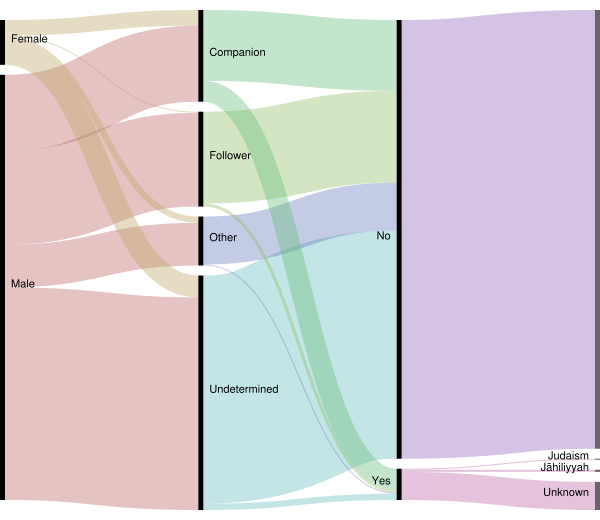
Our sample diagram uses the first option in Raw Density, which is what the creators behind Raw Density call an “Alluvial diagram (Fineo-like)”. (Fineo was a former research project by Density Design, the developers of Raw Density.) We’re using this type of diagram to show relationships among different types of categories.

Transmitters of early Islamic law

This diagram is based on 452 transmitters of early Islamic law. A transmitter is classified either as a companion or a follower. A companion is one who encountered Muhammad in his lifetime. A follower is one who lived in the generation after Muhammad’s death.

alluvialtransmittersStatusConverted

The data collected consists of 17 fields but for the purpose of this diagram we used only 4 categories: gender, transmitterStatus, Converted (Yes/No), priorRelgion. When the transmitterStatus was unknown then the transmitter was grouped into either other or undetermined.

In the diagram you can see how the colored ribbons visualize the data flow from the general category of gender to the more specific categories. The right-side of the diagram divides the transmitters into those that had converted from a prior religion (marked as ‘Yes’) and those that did not (marked as ‘No’).

Visualization allows for a clearer understanding of the data than is possible through a simple examination of tabular content in a spreadsheet. Visualization makes it easy to spot data collecting errors. For example, is there a distinction in the transmitterStatus field between Other and Undetermined or could we have collapsed that into a single field in our data collection form? Also, the visualization identifies where further research is needed, e.g., other data sources should provide details about whether the transmitters with undetermined/other status were companions or followers.

The students in this course will produce various visualizations using Raw Density.

Categories
DH Incentive Grants Pedagogy Research Projects Tools

Raw Density & early Islamic law

Professor Joel Blecher received a DH Incentive grant from W&L for the course History of Islamic Civilization I: Origins to 1500. A pedagogical DH component of that course is for students to produce a set of visualizations of data that they have collected about the transmission of early Islamic law. The students will be using two tools for the visualizations: Palladio and Raw Density.

In this post we’ll examine the use of Raw Density. Separate posts will explore the use of Palladio and the data collection process. This post will provide one example of a data visualization of early Islamic law.

 Raw Density

Raw Density is a Web app offering a simple way to generate visualizations from tabular data, e.g., spreadsheets or delimiter-separated values. Getting started with Raw is deceptively simple: just upload your data.

The complicated part is deciding which of the sixteen visuals is best for your data. While an entire course could be taught on data visualizations, the purpose within this course is for the students to develop familiarity with visualizing historical data. Not all types of charts are appropriate for every type of data.

Our sample diagram uses the first option in Raw Density, which is what the creators behind Raw Density call an “Alluvial diagram (Fineo-like)”. (Fineo was a former research project by Density Design, the developers of Raw Density.) We’re using this type of diagram to show relationships among different types of categories.

Transmitters of early Islamic law

This diagram is based on 452 transmitters of early Islamic law. A transmitter is classified either as a companion or a follower. A companion is one who encountered Muhammad in his lifetime. A follower is one who lived in the generation after Muhammad’s death.

alluvialtransmittersStatusConverted

The data collected consists of 17 fields but for the purpose of this diagram we used only 4 categories: gender, transmitterStatus, Converted (Yes/No), priorRelgion. When the transmitterStatus was unknown then the transmitter was grouped into either other or undetermined.

In the diagram you can see how the colored ribbons visualize the data flow from the general category of gender to the more specific categories. The right-side of the diagram divides the transmitters into those that had converted from a prior religion (marked as ‘Yes’) and those that did not (marked as ‘No’).

Visualization allows for a clearer understanding of the data than is possible through a simple examination of tabular content in a spreadsheet. Visualization makes it easy to spot data collecting errors. For example, is there a distinction in the transmitterStatus field between Other and Undetermined or could we have collapsed that into a single field in our data collection form? Also, the visualization identifies where further research is needed, e.g., other data sources should provide details about whether the transmitters with undetermined/other status were companions or followers.

The students in this course will produce various visualizations using Raw Density.

Categories
Event on campus

Digital Humanities Project/Assignment Workshopping Luncheon

Tuesday, October 14, 12:15pm – 1:15pm
Digital Humanities Project/Assignment Workshopping Luncheon
Science Addition 202A

Do you have an idea that you’d like to turn into a Digital Humanities class project? Do you plan to apply for an incentive grant this October? Have questions about how to prepare, support, or assess the project?

During this luncheon, you can meet with the members of the Digital Humanities Action Team and experienced faculty to discuss and prepare your project.

This session will take place in the IQ Center 3D Lab.

Register for the workshop at http://go.wlu.edu/dhworkshops