Categories
Curriculum DCI DH Pedagogy

Minor in Digital Culture and Information

We now have a new minor in Digital Culture and Information. This minor is an outcome of W&L’s digital humanities initiatives over the last six years.

We’re not abandoning the term DH. W&L will still continue to have a strong set of programmatic DH initiatives. We chose the term Digital Culture and Information (DCI) to recognize that our curricular efforts in DH extend beyond the humanities and into the social sciences, pre-professional fields (such as accounting, business administration, journalism, and strategic communication), and STEM disciplines. (And, yes, over the years we had huge debates over naming the minor.)

From our proposal for creating the minor:

An interdisciplinary program in Digital Culture and Information (DCI) allows students to deeply explore how the digital age impacts knowledge and society. Students will discover how software transforms information into valuable resources as well as the dangerous potential of algorithmically biased tools. Through courses that integrate theory with hands- on practice, students will develop creative projects that demonstrate their emerging expertise in digital media. The program is designed to teach students concepts and methods that will enhance their academic success within any major. Students participating in the program will gain significant experience with technological platforms, complex information resources, and visual design. The course of study nurtures critical reflection on the underlying structure of information and not merely technical proficiency. A minor in Digital Culture and Information provides the foundation for a career in any field and for life as an informed citizen in a digital society.

For those who are interested, here’s the full 23-page proposal for creating a minor in Digital Culture and Information (pdf).

Course of Study Requirements

Update: View the W&L site for the updated course of study.

A minor in digital culture and information requires completion of 18 credits, as follows. In meeting the requirements of this interdisciplinary minor, a student may not use more than nine credits (including capstone) that are also used to meet the requirements of other majors or minors. [The nine credits limitation is a W&L policy.]

Required courses:
DCI 102: Data in the Humanities (offered every Fall) 3 credits
DCI 108: Communication through the Web (offered every Fall) 3 credits

At least six credits chosen from the following:

DCI 110: Web Programming for Non-Programmers (offered every Winter) 4 credits
DCI 175: Innovations in Publishing (offered alternating Spring Terms) 4 credits
DCI 190: DH Studio [offered as needed] 1 credit
DCI 393: Creating Digital Scholarship (offered every Winter) 3 credits
DCI 403: Directed Individual Study (as needed) 3 credits
History 211: 19th-Century Scandal, Crime, Spectacle. 3 credits
Journalism 341: Multimedia Storytelling Design (offered every Winter) 3 credits

At least three credits chosen from the following:

Business 306: Seminar in Management Information Systems
Business 310: Management Information Systems
Business 315: Database Management for Business
Business 317: Data Mining for Sales, Marketing and Customer Relationship Management
Business 321: Multimedia Design and Development
Classics 343: Classics in the Digital Age
Computer Science (any course)
DCI 180 First-Year Seminars (offered every Fall and alternating Winter)
English 453: Internship in Literary Editing with Shenandoah
German 347: Goethe–Sentimentality to Sturm and Drang
German 349: Digital Goethe
Sociology 265: Exploring Social Networks
Sociology 266: Neighborhoods, Culture and Poverty
and, when approved in advance, DCI-designated courses offered in other disciplines.

Capstone project:
Three credits chosen from DCI 393, 403 (not used above), or a capstone or honors thesis in the major field of study, of sustained intellectual engagement using digital tools or methods and approved one term in advance of beginning by the core faculty of the minor

Portfolio:
At least three projects or assignments, in addition to the capstone, from courses in the minor which demonstrate attention to design, user experience, awareness of audience, and professional or academic context, and including both reflection on and analysis of each work in the portfolio.

Organizational issues

One of the distinguishing characteristics of the DCI minor is that it is based in the library though we still view it as an interdisciplinary minor with broad participation of faculty from other departments. Librarians at W&L have faculty status and the University Library is organized as an academic department within the College. The library faculty are teaching the required courses in DCI, coordinating the capstone and portfolio experiences, as well as teaching many of the DCI electives.

The official approval of this minor is a significant milestone for DH at W&L. It truly has been a collaborative effort over the years involving a lot of conversations, often with challenging viewpoints in those discussions. Collaboration is a process, and dissent is a critical element towards improving any initiative. Over time we talked it through, and we’re all better for that.

Thanks!

A huge thanks to Dean Suzanne Keen, who championed the digital humanities and provided the vision for DH in the undergraduate curriculum. We will miss her dearly and wish her the best in her new role at Hamilton.

Tremendous gratitude goes to Paul Youngman (Professor and Chair of German, Russian, and Arabic) for his brilliant leadership of the DH Committee.

Sara Sprenkle (Computer Science) for her enthusiastic support of a minor all along, for co-teaching with Paul the very first DH course at W&L in 2014, and all her efforts in DH here.

The library faculty have been remarkable in pulling together to create a curriculum. Jason Mickel (Director of Library Technology) came up with the term digital culture and information, and he eagerly embraces teaching at every possible opportunity. Mackenzie Brooks (DH librarian) shouldered the burden of co-teaching two DH courses with me, and she has demonstrated a remarkable aptitude in working with undergrads and developing her own courses. And thanks to all the librarians at W&L who are contributing to the new minor. The DCI minor is now a significant aspect of library instruction and belongs to all of us. The University Librarian John Tombarge deserves particular thanks for allowing us to even pursue this type of curricular initiative.

A special appreciation goes out to the two people who have served as Mellon DH Fellows at W&L. Brandon Walsh provided essential input into the structure of the minor. Sydney Bufkin thought deeply about the capstone experience and devoted significant effort this past year to co-drafting the proposal.

Thanks to our faculty colleagues who have contributed to DH at W&L and especially to those who provided feedback on the proposal, particularly Sarah Horowitz (History), Toni Locy (Journalism), Steve McCormick (French), and Jon Eastwood (Sociology).  We’re excited for future collaborations with faculty across campus as we make the DCI minor into a suitable complement for any academic major.

Of course, we do this for our students. It’s about them. We’re fortunate to have the opportunity to learn from these students. They make us better teachers.
Categories
DH Trip Report

Days of Networks & Social Capital

Enabling faculty and students to attend high-quality workshops is one of the most valued opportunities supported by our Mellon DH grant. I recently returned from a 4-day trip to Philadelphia with Jon Eastwood (Laurent Boetsch Term Professor of Sociology) and three brilliant undergrads at W&L: Elena Diller, C’17 (Sociology major with minors in Poverty Studies and Women, Gender, and Sexuality Studies ), Dani Leon, C’18 (Politics/Sociology double major with a minor in Poverty Studies), and Kassie Scott (English/Sociology double major with a minor in Poverty Studies). Jon attended a workshop on Casual Inference with Directed Graphs taught by Felix Elwert; Elena, Dani, Kassie, and I attended a workshop on Social Network Analysis (SNA) taught by Steve Borgatti. The latter workshop was recommended to us by Professor Megan Hess (Accounting), who had taken a workshop with Borgatti before. Both short courses were hosted by Statistical Horizons.

This post will focus on the SNA workshop, though we all learned a fascinating amount about Directed Acyclic Graphs from Jon Eastwood over meals and during the long drive back from Philadelphia. Jon reports that he will be bringing what he learned into the classroom this Fall Term as part of the course he will be teaching on Bayesian data analysis.

The workshop was two intensive days, 9-5, that provided an in-depth introduction to SNA, particularly with the use of the UCINET software package developed by Borgatti. The W&L students were the only undergrads in attendance, which is an indicator of the quality of opportunities that this university provides students. The class size was 28, consisting mostly of faculty, professionals in fields such as public health, government, and social work, as well as a few grad students. Medical school faculty were prominently represented. The W&L undergrads, not shy about asking questions, easily kept up with their more educated classmates.

The instructor, Steve Borgatti, is one of the leading scholars in the field. Borgatti is currently president of the International Network for Social Network Analysis and has published a wealth of literature that has received over 40,000 citations. Borgatti is a humble man whose jovial and bearded presence in blue jeans never conveys any hint of his standing within academia. The pace of the workshop was intense, thought provoking, and exhausting but well worth the effort. Borgatti structured the 2-day workshop as a mixture of lecture (with over 200 slides) and hands-on practice with UCINET. Attendees came away with an understanding of how to import different data structures into UCINET and the many network measures provided by the software.

As a Windows program, UCINET works well on Macs via the Windows emulator Wine. Step-by-step instructions for installing on a Mac via WineBottler work really well. My one bit of advice on installation for Macs is to make a symbolic link to the UCINET data folder, which is installed by WineBottler at “/Users/[username]/Library/Application Support/com.yourcompany.yourapp[numeric string]/drive_c/users/[username]/My Documents/UCINET data”. A symbolic link from your Desktop or elsewhere will make it easy to access the data files generated by UCINET.

UCINET is a good alternative for people who prefer a menu-driven interface over the command-driven approach of R. I would definitely recommend UCINET over Gephi. For my own SNA research, I suspect I will stick with R’s igraph package but I’m going to explore the possibilities of UCINET. As far as software goes, UCINET is simple to learn. It mostly works the same way for any feature or network measure: find the desired option under the menus, load the data set, set any additional options, and run. UCINET also comes with a command-line interface. The extensive HELP file provides references to scholarly articles for a large number of functions provided by the software.

Due to the computational nature of SNA, people new to the topic often approach it as a methodology or a tool. Borgatti emphasizes a distinction between the “theory of networks” as a way of explaining why networks exist and “network theory” as a way of understanding the consequences of networks. Borgatti stated that most SNA studies are about the consequences of networks.

A significant part of the second day of the workshop focused on egonets, which is a network focused on one person (the “ego”) and the connections that person has with others (the “alters”). Building on that discussion was an examination of social resource theory, associated with the scholar Nan Lin. Another conception of social capital is articulated by scholar Ron Burt via network analysis in the form of structural holes.

A variety of measures exist for SNA but I’m finding in my own research into literary networks that absorbing the network theory before embarking on the actual data analysis is having a positive impact on my understanding of the patterns and connections within literary publishing. Previously I have thrown my data set into network visualization tools as a means of exploring the data but I now feel better equipped to think about exactly which measures I should examine for better understanding the interchange among editors and authors in producing the outcome that is a literary magazine.

Borgatti covered a great number of topics in the two days, including a very mathematical discussion of the types of regression that can be done on network matrices. He also gave an overview of exponential random graph models (ERGMs) as a computational model for predicting the absence or presence of connections within a network.

SNA is not just about contemporary issues. Borgatti used the data set from a well-known study on the relationship of marriage and business ties among 15th century Florentine families that led to the rise of the Medici. Another historical topic covered was a study of 12th century Russia and the emergence of Moscow as a dominant location due to trade routes. In the latter study, we see that SNA can be applied to areas other than just interpersonal relationships. As Borgatti says, “Networks are everywhere” and network studies are found in the natural sciences, the social sciences, and the humanities.

I already mentioned the professional organization INSNA, which tends to focus on the social sciences. Another organization, the Network Science Society, focuses more on physics, computer science, biology, etc. While there is overlap among the two professional organizations, Borgatti describes the two as still “having a different feel”.

I’ll wrap up this report with a suggested reading. Just about anything by Borgatti is worthwhile, and a good starting point is his 2009 article in Science on Network Analysis in the Social Sciences. I highly recommend reading about the theories behind social network analysis and how those apply to your own research questions. Grasping those concepts before jumping into the tools of SNA will be very beneficial. Borgatti and his colleagues at the University of Kentucky’s LINKS Center for Social Network Analysis also have published an insightful article on Social Network Research: Confusions, Criticisms, and Controversies [PDF preprint].

Categories
DH Pedagogy

TimelineJS & the British Reformations

Students in a British history course recently completed an extensive timeline of the British Reformations in context. Professor Michelle Brock structured the project as an assignment that amounted to 15% of the course grade. The timeline also serves as a resource for students writing their final essays for the course. This approach to DH emphasizes that digital projects are not simply end products but also can inform written works.

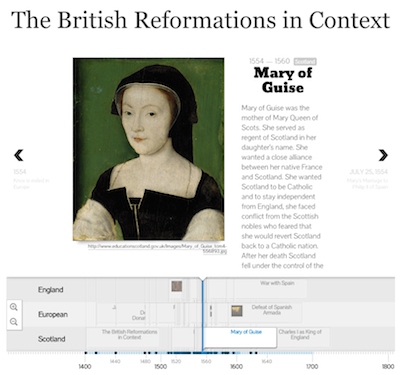
Screenshot of British Reformations in Context timeline

TimelineJS was chosen by Brock as the appropriate tool for this project due to its visual capabilities. Prior to the beginning of the term, Brock consulted with the DHAT to plan how to instruct students on using this tool to contextualize the British Reformations. An essential feature was the tag functionality of TimelineJS to indicate whether an event occured in the English Reformation, Scottish Reformation, or the Continental European Reformation. Brock describes the goal of the assignment:

“The goal of this three-tiered timeline is to give student a visual overview of the trajectory of the European, English, and Scottish Reformations, and a more tangible representation of the relationship between the three. This should also provide a deeper understanding of the English and Scottish Reformations in their European contexts, as well as an illustration of their respective local and national dimensions. Students will then use this timeline to help write their final essay.”

Students worked in three groups of four to populate the spreadsheet that powers the timeline. Students were responsible for identifying and entering key events, documents, and people for their respective Reformation (a period spanning between 1450 – 1650). Each entry had to include a brief descriptive paragraph (80 – 120 words) explaining the significance of the topic. Students were encouraged to include images where appropriate. And, if applicable, students could include links to video on YouTube.

Each member of the group was expected to contribute 7 – 10 entries. Groups were expected to work collaboratively over the course of the semester. A librarian provided initial training to the class on January 19. The students completed their work on March 30. In addition, all the students had to turn in an individual timeline report that specified which entries they wrote and the list of sources used to write those entries.

The final timeline has 73 entries about the Reformations.

Interested in using TimelineJS in your couse? See our introduction to TimelineJS.

Categories
Pedagogy Tools

TimelineJS & the British Reformations

Students in a British history course recently completed an extensive timeline of the British Reformations in context. Professor Michelle Brock structured the project as an assignment that amounted to 15% of the course grade. The timeline also serves as a resource for students writing their final essays for the course. This approach to DH emphasizes that digital projects are not simply end products but also can inform written works.

Screenshot of British Reformations in Context timeline

TimelineJS was chosen by Brock as the appropriate tool for this project due to its visual capabilities. Prior to the beginning of the term, Brock consulted with the DHAT to plan how to instruct students on using this tool to contextualize the British Reformations. An essential feature was the tag functionality of TimelineJS to indicate whether an event occured in the English Reformation, Scottish Reformation, or the Continental European Reformation. Brock describes the goal of the assignment:

“The goal of this three-tiered timeline is to give student a visual overview of the trajectory of the European, English, and Scottish Reformations, and a more tangible representation of the relationship between the three. This should also provide a deeper understanding of the English and Scottish Reformations in their European contexts, as well as an illustration of their respective local and national dimensions. Students will then use this timeline to help write their final essay.”

Students worked in three groups of four to populate the spreadsheet that powers the timeline. Students were responsible for identifying and entering key events, documents, and people for their respective Reformation (a period spanning between 1450 – 1650). Each entry had to include a brief descriptive paragraph (80 – 120 words) explaining the significance of the topic. Students were encouraged to include images where appropriate. And, if applicable, students could include links to video on YouTube.

Each member of the group was expected to contribute 7 – 10 entries. Groups were expected to work collaboratively over the course of the semester. A librarian provided initial training to the class on January 19. The students completed their work on March 30. In addition, all the students had to turn in an individual timeline report that specified which entries they wrote and the list of sources used to write those entries.

The final timeline has 73 entries about the Reformations.

Interested in using TimelineJS in your couse? See our introduction to TimelineJS.

Categories
DH Incentive Grants Pedagogy Research Projects Tools

Raw Density & early Islamic law

Professor Joel Blecher received a DH Incentive grant from W&L for the course History of Islamic Civilization I: Origins to 1500. A pedagogical DH component of that course is for students to produce a set of visualizations of data that they have collected about the transmission of early Islamic law. The students will be using two tools for the visualizations: Palladio and Raw Density.

In this post we’ll examine the use of Raw Density. Separate posts will explore the use of Palladio and the data collection process. This post will provide one example of a data visualization of early Islamic law.

 Raw Density

Raw Density is a Web app offering a simple way to generate visualizations from tabular data, e.g., spreadsheets or delimiter-separated values. Getting started with Raw is deceptively simple: just upload your data.

The complicated part is deciding which of the sixteen visuals is best for your data. While an entire course could be taught on data visualizations, the purpose within this course is for the students to develop familiarity with visualizing historical data. Not all types of charts are appropriate for every type of data.

Our sample diagram uses the first option in Raw Density, which is what the creators behind Raw Density call an “Alluvial diagram (Fineo-like)”. (Fineo was a former research project by Density Design, the developers of Raw Density.) We’re using this type of diagram to show relationships among different types of categories.

Transmitters of early Islamic law

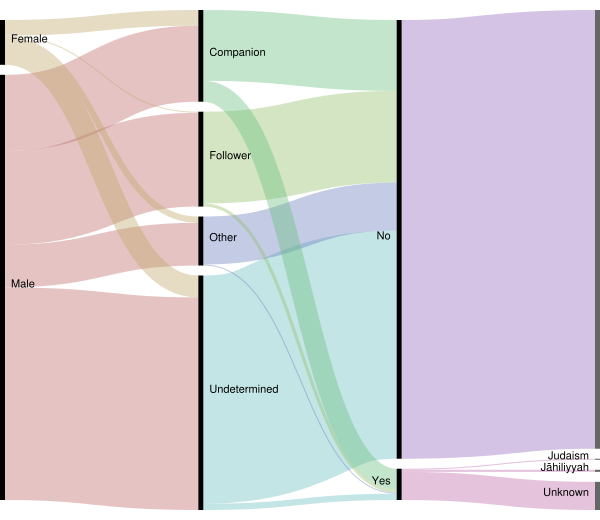
This diagram is based on 452 transmitters of early Islamic law. A transmitter is classified either as a companion or a follower. A companion is one who encountered Muhammad in his lifetime. A follower is one who lived in the generation after Muhammad’s death.

alluvialtransmittersStatusConverted

The data collected consists of 17 fields but for the purpose of this diagram we used only 4 categories: gender, transmitterStatus, Converted (Yes/No), priorRelgion. When the transmitterStatus was unknown then the transmitter was grouped into either other or undetermined.

In the diagram you can see how the colored ribbons visualize the data flow from the general category of gender to the more specific categories. The right-side of the diagram divides the transmitters into those that had converted from a prior religion (marked as ‘Yes’) and those that did not (marked as ‘No’).

Visualization allows for a clearer understanding of the data than is possible through a simple examination of tabular content in a spreadsheet. Visualization makes it easy to spot data collecting errors. For example, is there a distinction in the transmitterStatus field between Other and Undetermined or could we have collapsed that into a single field in our data collection form? Also, the visualization identifies where further research is needed, e.g., other data sources should provide details about whether the transmitters with undetermined/other status were companions or followers.

The students in this course will produce various visualizations using Raw Density.

Categories
DH Incentive Grants Pedagogy Project Update Tools

Raw Density & early Islamic law

Professor Joel Blecher received a DH Incentive grant from W&L for the course History of Islamic Civilization I: Origins to 1500. A pedagogical DH component of that course is for students to produce a set of visualizations of data that they have collected about the transmission of early Islamic law. The students will be using two tools for the visualizations: Palladio and Raw Density.

In this post we’ll examine the use of Raw Density. Separate posts will explore the use of Palladio and the data collection process. This post will provide one example of a data visualization of early Islamic law.

 Raw Density

Raw Density is a Web app offering a simple way to generate visualizations from tabular data, e.g., spreadsheets or delimiter-separated values. Getting started with Raw is deceptively simple: just upload your data.

The complicated part is deciding which of the sixteen visuals is best for your data. While an entire course could be taught on data visualizations, the purpose within this course is for the students to develop familiarity with visualizing historical data. Not all types of charts are appropriate for every type of data.

Our sample diagram uses the first option in Raw Density, which is what the creators behind Raw Density call an “Alluvial diagram (Fineo-like)”. (Fineo was a former research project by Density Design, the developers of Raw Density.) We’re using this type of diagram to show relationships among different types of categories.

Transmitters of early Islamic law

This diagram is based on 452 transmitters of early Islamic law. A transmitter is classified either as a companion or a follower. A companion is one who encountered Muhammad in his lifetime. A follower is one who lived in the generation after Muhammad’s death.

alluvialtransmittersStatusConverted

The data collected consists of 17 fields but for the purpose of this diagram we used only 4 categories: gender, transmitterStatus, Converted (Yes/No), priorRelgion. When the transmitterStatus was unknown then the transmitter was grouped into either other or undetermined.

In the diagram you can see how the colored ribbons visualize the data flow from the general category of gender to the more specific categories. The right-side of the diagram divides the transmitters into those that had converted from a prior religion (marked as ‘Yes’) and those that did not (marked as ‘No’).

Visualization allows for a clearer understanding of the data than is possible through a simple examination of tabular content in a spreadsheet. Visualization makes it easy to spot data collecting errors. For example, is there a distinction in the transmitterStatus field between Other and Undetermined or could we have collapsed that into a single field in our data collection form? Also, the visualization identifies where further research is needed, e.g., other data sources should provide details about whether the transmitters with undetermined/other status were companions or followers.

The students in this course will produce various visualizations using Raw Density.

Categories
Event on campus

Fall 2014 DH Workshops

The DH Working Group announces 3 workshops this fall. Free lunch included!

Monday, September 22, 2014, 12:15pm – 1:15pm
Digital Humanities Tools in the Classroom: Annotation Studio
Hillel House 101

Annotation is one method for textual engagement among many available in students’ toolkits. It is a form of active reading that documents a student’s personal learning process, combining reading with critical thinking and learning, which then allows students to practice research skills as novice scholars. Through the process of annotation, students become engaged in the analysis of texts, inspiring them to conduct further research, perhaps through text mining or data visualizations. Annotation Studio, developed by HyperStudio, the digital humanities center at M.I.T. in consultation with university instructors throughout the country, is an easy-to-use, web-based, multimedia, annotation application. However, within Annotation Studio’s digital learning environment, annotation allows for a new form of interactive reading, one that can seamlessly transition between traditional forms of solitary highlighting or note taking to collaborative close reading or shared discussions about particular passages. Digital annotation creates opportunities for new forms of social engagement with the text, for readers to share ideas, interpretations, references, sources, adaptations, or related media with other students that significantly change the way students acquire and produce knowledge. While Annotation Studio is not the only digital annotation tool available, it is unique in being the only Open-source digital annotation tool focused on the inextricably interconnected pillars of higher education: supporting the student learning process and improving pedagogy. 

Rachel Schnepper, communications officer at HyperStudio, will present a series of case studies from uses of Annotation Studio in writing/composition, foreign language, and media studies classes. Through these case studies, we will demonstrate how Annotation Studio has not only continued to support traditional learning goals, such as critical thinking and analytical writing, but also promoted student learning through the application of students’ new media literacies and the peer-to-peer learning enabled by the collaborative space of digital annotation. Furthermore, through our discussion of Annotation Studio case studies, we will also establish how the application allows educators to respond and adapt with new pedagogical practices to improve student learning. Ultimately, these learning and pedagogical insights allow us at HyperStudio to reflect on the development and management of digital humanities tools, insights that are themselves essential to the continued role that digital humanities centers play at colleges and universities. 

Presenter: Rachel N. Schnepper, M.I.T. HyperStudio

Register for the workshop at http://go.wlu.edu/dhworkshops


Tuesday, October 14, 12:15pm – 1:15pm
Digital Humanities Project/Assignment Workshopping Luncheon
Science Addition 202A

Do you have an idea that you’d like to turn into a Digital Humanities class project? Do you plan to apply for an incentive grant this October? Have questions about how to prepare, support, or assess the project?

During this luncheon, you can meet with the members of the Digital Humanities Action Team and experienced faculty to discuss and prepare your project.

This session will take place in the IQ Center 3D Lab.

Register for the workshop at http://go.wlu.edu/dhworkshops


Wednesday, November 12, 2014
Digital Humanities November Luncheon
Hillel House 101

More details to follow.

Register for the workshop at http://go.wlu.edu/dhworkshops


Categories
Event on campus

Center for Digital Storytelling Workshop Application Available

Academic Technologies will be hosting a digital storytelling workshop for W&L faculty, January 7-9, facilitated by the Center for Digital Storytelling.

During this three-day hands-on workshop, participants will learn about the pedagogy of digital storytelling while creating their own 3-5 minute multimedia narratives using iMovie and Audacity.

Breakfasts and lunches will be catered all three days of the workshop.

There are eleven slots available for the workshop; applicants will be chosen based on strength of proposals for incorporating digital storytelling into their class(es) and ability to attend all three days of the workshop. Faculty from all disciplines are encouraged to apply.

If you would like to be considered for the workshop, please submit your application by Friday, October 3.

Applicants will be notified by October 15, 2014 if they have been accepted into the workshop.

Questions? Please contact Julie Knudson, Director of Academic Technologies, or Brandon Bucy, PhD, Senior Academic Technologist.


Categories
Pedagogy

Case study in DH at a liberal arts college

If you’re wondering how DH got started at W&L and what’s been happening here over the last couple of years with DH, then you’ll want to read Launching the Digital Humanities Movement at Washington and Lee University: A Case Study.

Here’s an excerpt:

Improving student learning, however, first requires defining the learning outcomes expected through DH. One can find an excellent set of learning outcomes and priorities in Digital_Humanities emphasizing “the ability to think critically with digital methods to formulate projects that have humanities questions at their core” (Burdick et al. 2012, 134). Indeed, the mode of critical thinking with digital methods must be incorporated within the mindset of faculty, IT professionals, and librarians to effectively teach with the digital humanities.

Such thinking is the key to the future of digital humanities on this campus. Dean Keen offers an energetic vision:

In ten years, digital humanities projects will be so diffused throughout the curriculum that they no longer look experimental; they gain broad acceptance as a legitimate mode of student work. Student transcripts contain links to their DH projects as part of demonstrated student learning outcomes. Our liberal arts grads possess not only information fluency, but the craft skills to make and manipulate digital artifacts. Parsing large data sets in easily visualized and nuanced ways becomes a normal skill of our humanities grads, along with writing and critical thinking (Suzanne Keen, e-mail message to author, March 11, 2014).

The key for success of the digital humanities at a small liberal arts college is to focus on the learning outcomes. Identify the knowledge and skills that students should acquire through the DH assignments in a course, and think deeply about how students can transfer that digital learning to their other courses and their lives beyond graduation. In the end, the value of the digital humanities is to reinforce the critical thinking and lifelong learning skills that are the foundation of a liberal arts education.

Categories
Announcement Incentive Grants

Call for Digital Humanities Incentive Grants, 2014-2015

Washington and Lee faculty:

Are you considering employing Digital Humanities pedagogy in a fall 2014 or winter 2015 course? If you are undertaking an ambitious new augmenation of your teaching toolbox, one that will introduce you and your students to humanities/social science computing skill sets, tell us about it. Propose your fall or winter DH course-based project to DHAT@wlu.edu by Monday, 21 April, the first day of Spring Term. Members of the Digital Humanities Working Group will select two fall term and two winter term DH course projects for $1,000 stipends.

Competitve proposals will integrate computing tools such as visualization techniques (Mapplication, Timeline), data mining, computational analysis, digitized annotated editions of texts, or crowd-sourced interpretations. Preference will be given to plausible projects that will reach all students in your course: tell us about how you think you’d evaluate their work. How will your DH project help students meet course, program, or FDR learning objectives?

The DHAT (Digital Humanities Action Team) members are ready to assist DH projects, large and small. Check out what W&L faculty have already done at Generally Digital. If you have a course project you’d like to add to our blog, write to DHAT@wlu.edu .

All undergraduate courses and faculty are eligible to apply except for those who have already received an incentive grant in the first round.

Suzanne Keen, Dean of the College