Categories
DH Incentive Grants Pedagogy

Kelli Shermeyer on “Using DH to Explore Movement and Meaning”

Enjoy this guest post by Kelli Shermeyer, Doctoral candidate in the UVA English department, in which she describes her work with Professor Holly Pickett’s English 380 course at W&L. This work is supported by an ASC grant expanding collaboration between W&L and the Scholars’ Lab. Cross-posted on the Scholars’ Lab blog.

“Playwrights write plays for the stage, not the study,” or so Roland Broude reminds us.[i] Yet in my field of English literature, it’s quite common to study a play primarily as a textual object rather than a performance whose final form, tone, and affect all rely on extra-textual features. We don’t typically account for changes in play’s text during its first rehearsals (often these changes are implemented after the play text has been sent to print!), refinements in timing and intonation that occur during a show’s run, or even accidental line drops, forgotten words, or ad libs contrived by actors in reaction to something that happened during a particular performance. The reality of theater is that plays are constantly rewritten in a multitude of ways and we don’t have a lot of good ways to talk about that beyond acknowledgement.

In our world of the single-author study and the copyright, one of the consequences of seeing dramatic texts primarily as “literature” is the following assumption that the play is entirely the property of its author, who, as Broude argues, “exercises over it a droît moral: his is the sole right to establish the text, and, once it has been established, to alter it.”[ii] Teaching from this paradigm limits engagement with the performer or designer’s role in creating the play’s affect or meaning.

My work as a teacher, researcher, and theater director is to employ the digital humanities to help create ways that empower students to see a play as a complex nexus of decisions rather than a static textual object (for even the text itself is not stable). The problem that quickly surfaces is that performance (in many of its forms) is actually rather tricky to write about, because while we may have access to many versions and editions of the textual object (script), each enactment of that script is essentially ephemeral—a portion of it remains unrecoupable.

Peggy Phelan has claimed that the ontology of performance is essentially its irreproducibility[iii] and she acknowledges the difficulty this presents in analyzing performance art. We can try to fix parts of performance in a variety of non-performative forms such as narrative, photograph, or video recording, but those other media can only offer ekphrasis, not full reproduction. The ephemerality of performance gives it much of its affective weight and political potential. While we may not be able to entirely recapture performance outside of ekphrasis, my hope is that we can develop tools and methods for examining dramatic texts and performances that can help us to translate some of the harder-to-capture elements of performance into forms on which we can engage in various kinds of analysis or reflection.[iv] One of the questions I am currently thinking through is how can we “read” movement?

There’s some interesting work from the dance world that begins to think through these issues. Choreographer William Forsythe’s work with the Ohio State University (called Synchronous Objects) is particularly fascinating. Earlier work by choreographers such Rudolf Laban developed notational systems for dancers based on certain ideas about the body in space (Labanotation, for example).[v] But I’ve been struggling to try to find a way that connects movement and text (like a script) in a meaningful way. How do certain textual features invite us to think about certain movements? What in the text tells us to move to a particular place or in a particular way? Asking students these questions is also a way of approaching the critical practices like the close reading and formal analysis which still remains important to much (but not all!) of our work in literary studies.

As a way to experiment with the relationship between movement and language, I worked with Holly Pickett’s English 380 class on two activities to help us discuss the relationship between the text and blocking of a scene. (Blocking is both a noun and a verb: it describes both the pattern of movement in a given scene and the act of directing/designing those movement patterns in rehearsal). First, I gave them the “to be or not to be” monologue from Hamlet Act 3, scene 1. I selected this text because I thought it was one they may be marginally familiar with and one that doesn’t contain many stage directions within the language (for example, when a character says “come here,” cuing another actor’s movement).

I instructed them to draw Hamlet’s path throughout the monologue—where does he start, end, and where does he move throughout the speech? I did not give them any instructions on how to notate pauses, changing positions or how long Hamlet took to walk somewhere as I was interested in seeing how they would choose to notate this.

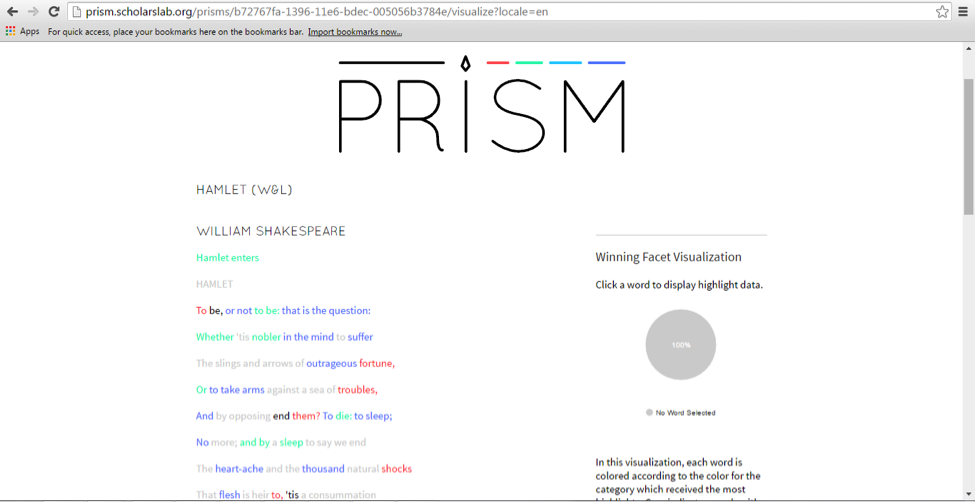
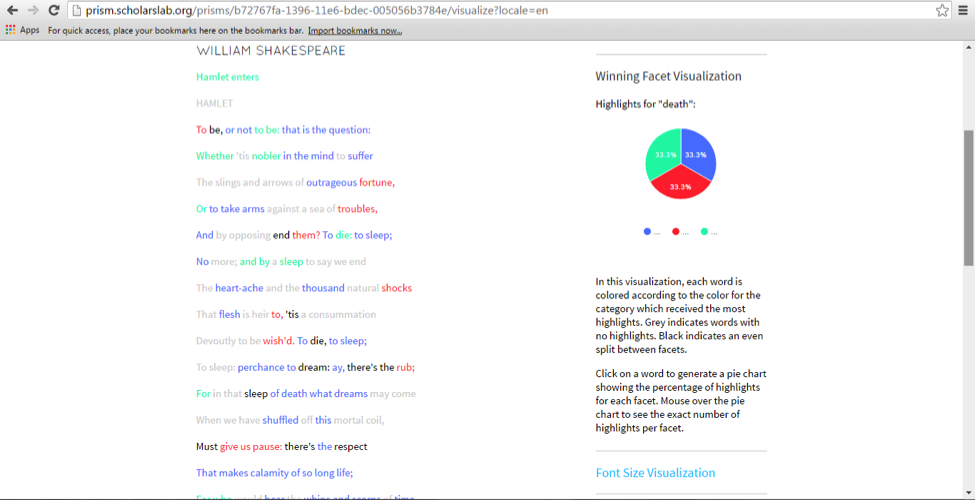
I also asked them to use Prism to mark up the monologue, indicating where Hamlet started moving, stopped moving, or changed position in their blocking. I did not tell them in which order to do these tasks just that they had to do both of them. At the end of the allotted 20 minutes, I taped all of the drawings on the board and pressed the visualization button on Prism to see what we found. The Prism results revealed that there was a great variety in blocking styles, yet there were definable loci of energy around certain parts of the text. (Here’s the full visualization)

In this first image, you can see that a lot of students notated something around “end them? To die; to sleep,” but there disagreement as to what Hamlet was doing at those moments.

prism 1

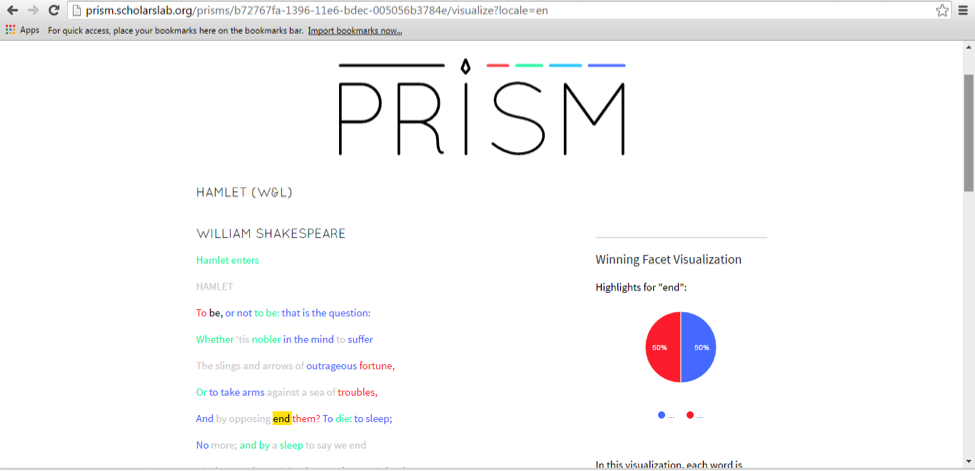
We zeroed in on the word “end” as Prism showed there was some debate as to what movement happened on that word. The Prism showed that students either had Hamlet change position without changing location (indicated by the blue) or stop moving all together (indicated by the red). No one had Hamlet begin moving on this word (which would have been indicated by green).

prism 2

Throughout the whole monologue, “die” and “death” continued to appear as words where students thought some kind of movement or position change should occur, but we couldn’t agree as to what that movement should be:

prism 3

prism 4

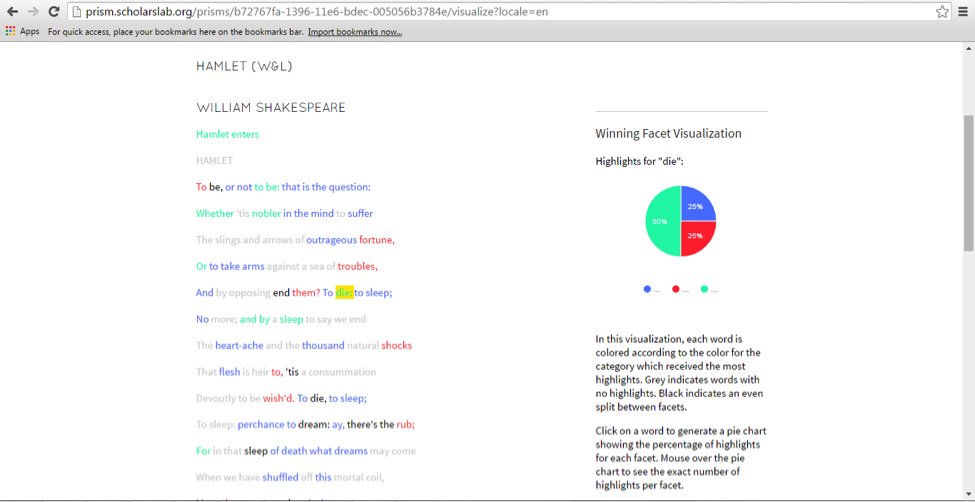
I have no definitive way to explain this: only a director’s hunch that there’s some sort of affective energy around the word and concept of death that we associate with anxiety that incites us to movement—we (or at least most of us) do not want to be still when facing death. Part of my future work is figuring out how to interpret these results.

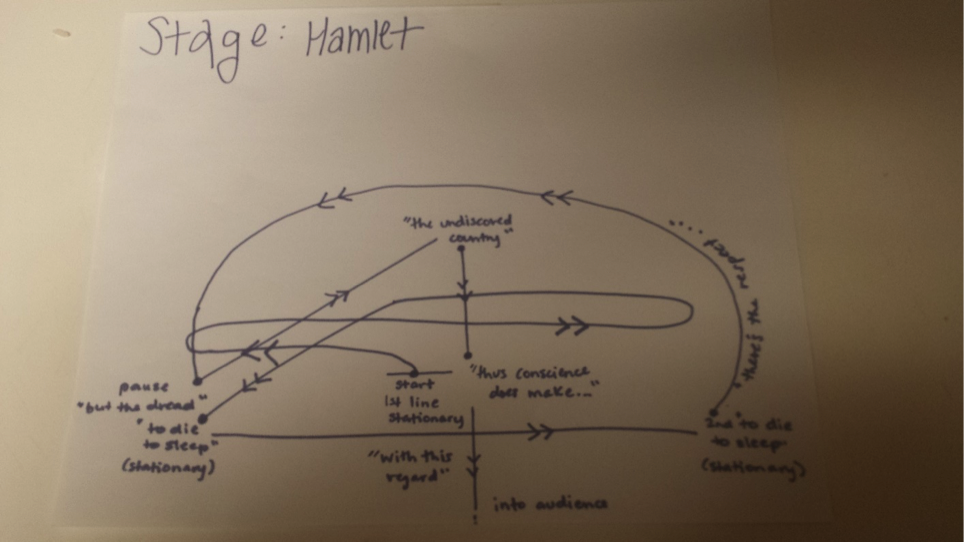
The other part of the activity—the drawings of Hamlet’s path—are much harder to read. Most drawings started Hamlet out on the center of the stage, not accounting for the first bit of text printed in the monologue directing that “Hamlet enters.” To me, this suggests some kind of connection between what we know about Hamlet, the role of this speech in the play, and center stage—we know Hamlet is the central figure and associate this important monologue with the center stage. But aside from that, the patterns varied. Most were well-balanced with Hamlet spending time on both sides of the stage (my mentors would be proud that both sides of the audience would get an equally good view of the actor). Some incorporated gestures or moments of intentional stillness. Many contained loops. Professor Pickett explained that she chose to do this in her drawing because of how she views the speech as rhetorically winding and wanted to create a movement pattern that reflected her reading.

Several of the students actually marked words on their drawings as well connecting the text directly to their movement patterns:

student hamlet

student hamlet 2

Some used no text at all and focused on the shape of Hamlet’s movements:

student hamlet 3

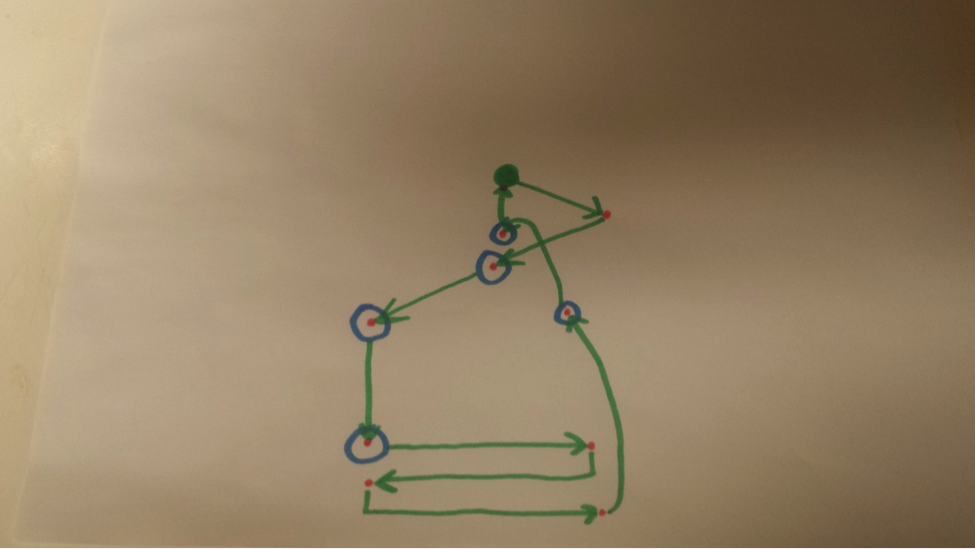
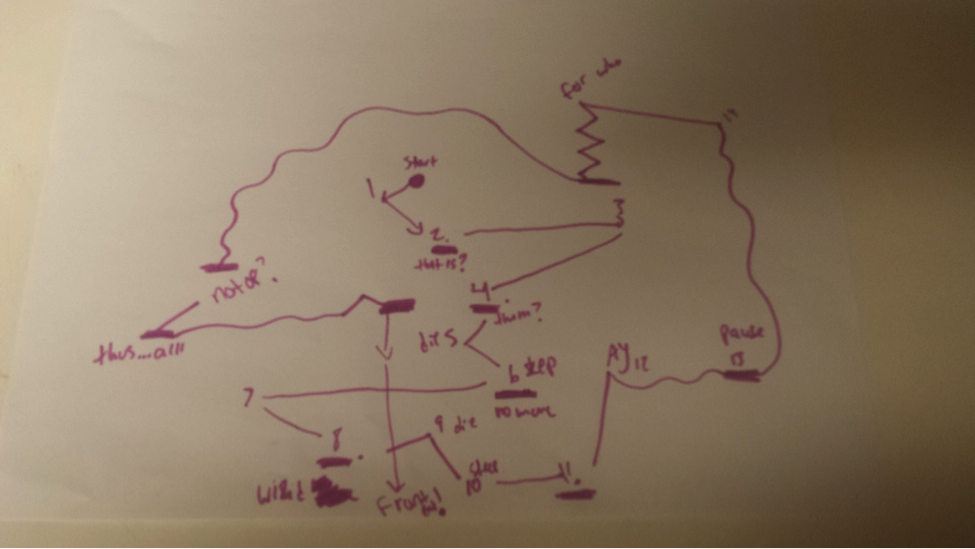
And here’s one that was purposely playing with Hamlet’s winding rhetoric:

student hamlet 4

So how do we make meaning out of all of this data?

I’m in the process (the slow, painful process) of developing a tool (or likely, a set of tools) to help students visualize the connection between play text and movement patterns. By considering the way language suggests movement will, I hope, allow for a richer consideration of the formal stylistics of particular plays, but also in the long run create corpus of data on the way people see theatre texts. I’m interested in what new areas of inquiry open up if I can use a digital tool to process many blocking patterns of the same scene (i.e. perform a kind of distant reading on the movement patterns that I had the students create). At the least, we can get students to think more deeply about the way that the dramatic text is a living document brought to life, challenged, and enriched by a consideration of the ways its interacts with the body, and embodiment.

This is important work for me both as a literary scholar and a theater director because of the reciprocal relationship between movement and interpretation. The director interprets the text to find places to block movement, and then the audience uses those movements to interpret certain moments on stage. Thinking about the relationship between movement and interpretation helps us to counter the belief that the playwright alone fixes the meaning of his or her “original text” and to recognize the larger networks of people, practices, traditions, and texts that make theater mean something.

[i] Broude, Roland. Performance and the Socialized Text. Textual Cultures: Texts, Contexts, Interpretation, Volume 6, Number 2, 2011, 24.

[ii] Ibid. 25.

[iii] Phelan, Peggy. Unmarked : The Politics of Performance. London ; Routledge, 1993.

[iv] It’s entirely worth noting that there should be a lively debate about if there are elements of performance that should not be recorded or analyzed as well. Is the kind of work we’re doing creating a richer context for talking about performances, or are we violently decontextualizing aspects of performance that can’t be understood without the full (but sadly unrecoverable) picture? (Many thanks to Purdom Linblad for first asking me a version of this question!)

[v] I was made aware of this interesting work in dance through sitting in on “The Art of Dance” taught by Kim Brooks Mata in the summer of 2015.

Categories
Incentive Grants Pedagogy

Michelle Brock on “Choose Your Own Witch-trials”

Enjoy this post by Michelle Brock, Assistant Professor of History and DH Incentive Grant Awardee 2015-2016

The Idea:

My course on the Age of the Witch-hunts is designed to introduce students to one of the most fascinating and disturbing events in the history of the Western world. Between 1450 and 1750, at least 100,000 individuals, mostly women, were accused of witchcraft in Europe and North America. Of these, roughly half met their demise at the stake or in the noose. A variety of social, religious, judicial, and political causes, none of which is singularly responsible, lurk behind this tragedy. Over the course of the semester, this class examines the litany of complex reasons for the witch-hunts, asking why they occurred when and where they did, why certain people were accused, why the trials finally ended, and how scholars from a multiple disciplines continue to grapple with this topic.

In designing a final project for teaching this course in Winter 2016, I kept thinking of the Choose Your Own Adventure gamebook series that I loved as a child. In these short, interactive works, the reader plays the protagonist of the story, making choices that lead down surprising paths, ultimately shaping the plot and the ending. I knew I wanted to create a similarly interactive assignment for my Age of the Witch-hunts class. With the help of the Mackenzie Brooks and Brandon Bucy at the W&L Library and Academic Technologies, I designed the “Choose Your Own Witch-trial” project to allow my Age of the Witch-hunts students to explore regional differences in the European witch-trials in a fun, collaborative, and informative way.

The reasons for using the Inklewriter interactive format rather than assigning a traditional research paper, were threefold. First, this method encouraged students to pay close attention to historical detail and contextual specificity, and to recognize the difficulty in forming broad causal explanations for such phenomena. Second, I suspected this project would be interesting and collectively engaging in ways that an individual, traditional research paper would not be. Last, the textual gaming method allowed students, as both creators and players of the games, to place themselves in the shoes of those who observed, orchestrated, and, most important, fell victim to the witch-hunts. This, I hope, helped to build empathy and understanding of world-views profoundly different than theirs while also providing an opportunity for reflection about our own belief systems and choices. Throughout, I reminded my students that while these games were supposed to be fun to create, any entertainment factor ought not obscure the fact that the witch-hunts were a genuine human tragedy that claimed tens of thousands of innocent lives.

The Project:

For this project, students worked in pairs to create text-based games using Inklewriter, a free tool that allows users to write interactive stories with twists, turns, and a variety of possible endings. Each pair was assigned a region in early modern Europe that experienced significant levels of witch-hunting. Despite important shared themes, there existed remarkable variety in the nature of witch belief and witch-hunting in different areas. For example, while 85% of those tried for witchcraft in Western Europe were women, the majority of the accused in Russia were male. While the use of torture during trials frequent in the very decentralized Holy Roman Empire, it was illegal in England, where the courts were tightly controlled. In Calvinist Scotland, possession cases rarely attended outbreaks of witchcraft, while the two were often linked in France. Students were accordingly asked to conduct significant historical research into the witch-trials in their specific region. They turned in annotated bibliographies of their sources early in the semester, as well as papers explaining the historical background of their games at the end of the term.

When creating their “Choose Your Own Witch-trial” game, each pair of students made their game model the nature of the witch-hunts in their specific region, paying close attention to the types of people accused, the chronology of the trials, the standards of evidence, the religious climate of the area, the types of punishment doled out, etc. Their games began with the initial accusation and continued through to the ultimate verdict. Groups had the option to write from the perspective of a third party observer, a jury member (if applicable), the orchestrators of the trial (often a clergyman or a local magistrate), or the accused witch. All but one group chose the perspective of the accused witch. At the end of the semester, the class collectively played all of the games over the space of two class periods (each pair taking 20-25 minutes for their game and following Q&A), after which each student wrote a final essay noting the regional variations they observed and examining what factors seem to have most shaped the course, chronology, and severity of the trials across Europe.

Assessment and Evaluation:

The project was assessed in three ways: the quality, accuracy, and creativity of the final games; the annotated bibliographies and historical background essays turned in by each student; and the response essays to the class gameplay. While I set minimum parameters for sources, the length of the games, and the attendant papers, the students were otherwise left to determine the content and course of their games. I did not want to give so much direction that it would stifle creativity; really, I just wanted to see what the students would come up with. I required each pair to meet with me no later than the week before the games were due in order to assess their progress and catch any potential technological or content issues in their games. Much to my surprise, not one group had any trouble using the software after it had been explained by Brandon Bucy at the start of the project. The lesson here, of course, is that my students are much savvier with technology than I am!

The overall quality of the games was generally quite high, and students reported that this was one of the most engaging and informative assignments they had encountered in their college career thus far. Next time I assign this project, I plan to increase the minimum length of the games by requiring students to include more background and more choices for the player, as some games were noticeably longer and more detailed than others. Other than this, however, I was thrilled by the results and would highly recommend the use of Inklewriter for the creation of text-based games in the college classroom.

The Games:

France

Scotland

Poland

Denmark

England

Russia

Categories
DH Pedagogy Research Projects

Reflections on a Year of DH Mentoring

[Cross-posted on the Scholars’ Lab blog]

This year I am working with Eric Rochester in the Scholars’ Lab on a fellowship project that has me learning natural language processing (NLP), the application of computational methods to human languages. We’re adapting these techniques to study quotation marks in the novels of Virginia Woolf (read more about the project here). We actually started several months before this academic year began, and, as we close out another semester, I have been spending time thinking about just what has made it such an effective learning experience for me. I already had a technical background from my time in the Scholars’ Lab at the beginning of the process, but I had no experience with Python or NLP. Now I feel most comfortable with the former of any other programming language and familiar enough with the latter to experiment with it in my own work.

The general mode of proceeding has been this: depending on schedules and deadlines, we meet once or twice every two weeks. Between our meetings I would work as far and as much as I could, and the sessions would offer a space for Eric and me to talk about what I had done. The following are a handful of things we have done that, I think, have helped to create such an effective environment for learning new technical skills. Though they are particular to this study, I think they can be usefully extrapolated to apply to many other project-based courses of study in digital humanities. They are primarily written from the perspective of a student but with an eye to how and why the methods Eric used proved so effective for me.

Let the Wheel Be Reinvented Before Sharing Shortcuts

I came to Eric with a very small program adapted from Matt Jockers’s book on Text Analysis with R for Students of Literature that did little beyond count quotation marks and give some basic statistics. I was learning as I built the thing, so I was unaware that I was reinventing the wheel in many cases, rebuilding many protocols for dealing with commonly recognized problems that come from working with natural language. After working on my program and my approach to a degree of satisfaction, Eric pulled back the curtain to reveal that a commonly used python module, the Natural Language ToolKit (NLTK), could address many of my issues and more. NLTK came as something of a revelation, and working inductively in this way gave me a great sense of the underlying problems the tools could address. By inventing my own way to read in a text, clean it to make its text uniformly readable by the computer, and breaking the whole piece into a series of words that could be analyzed, I understood the magic behind a couple lines of NLTK code that could do all that for me. The experience also helped me to recognize ways in which we would have to adapt NLTK for our own purposes as I worked through the book.

Have a Plan, but Be Flexible

After discussing NLTK and how it offered an easier way of doing the things that I wanted, Eric had me systematically work through the NLTK book for a few months. Our meetings took on the character of an independent study: the book set the syllabus, and I went through the first seven chapters at my own pace. Working from a book gave our meetings structure, but we were careful not to hew too closely to the material. Not all chapters were relevant to the project, and we cut sections of the book accordingly. We shaped the course of study to the intellectual questions rather than the other way around.

Move from Theory to Practice / Textbook to Project

As I worked through the book, I was able to recognize certain sections that felt most relevant to the Woolf work. Once I felt as though I had reached a critical mass, we switched from the book to the project itself and started working. I tend to learn from doing best, so the shift from theory to execution was a natural one. The quick and satisfying transition helped the work to feel productive right away: I was applying my new skills as I was still learning to feel comfortable with them. Where the initial months had more the feel of a traditional student-teacher interaction, the project-based approach we took up at this point felt more like a real and true collaboration. Eric and I would develop to-do items together, we would work alongside each other, and we would talk over the project together.

Document Everything

Between our meetings I would work as far and as much as I could, carefully noting places at which I encountered problems. In some cases, these were conceptual problems that needed clarifying, and these larger questions frequently found their way into separate notes. But my questions were frequently about what a particular line of code, a particular command or function, might be doing. In that case, I made comments directly in the code describing my confusion. I quickly found that these notes were as much for me as for Eric–I needed to get back in the frame of mind that led to the confusion in the first place, and copious notes helped remind me what the problem was. These notes offered a point of departure for our meetings: we always had a place to start, and we did so based on the work that I had done.

Communicate in as Many Ways as Possible

We met in person as much as possible, but we also used a variety of other platforms to keep things moving. Eric and I had all of our code on GitHub so that we could share everything that we had each been working on and discuss things from a distance if necessary. Email, obviously, can do a lot, but I found the chat capabilities of the Scholars’ Lab’s IRC channel to be far better for this sort of work. If I hit a particular snag that would only require a couple minutes for Eric to answer, we could quickly work things out through a web chat. With Skype and Google Hangouts we could even share the code on the other person’s computer even from hundreds of miles away. All of these things meant that we could keep working around whatever life events happened to call us away.

Recognize Spinning Wheels

These multiple avenues of communication are especially important when teaching technical skills. Not all questions or problems are the same: students can work through some on their own, but others can take them days to troubleshoot. Some amount of frustration is a necessary part of learning, and I do think it’s necessary that students learn to confront technical problems on their own. But not all frustration is pedagogically productive. There comes a point when you have tried a dozen potential solutions and you feel as though you have hit a wall. An extra set of eyes can (and should) help. Eric and I talked constantly about how to recognize when it was time for me to ask for help, and low-impact channels of communication like IRC could allow him to give me quick fixes to what, to me at least, seemed like impossible problems. Software development is a collaborative process, and asking for help is an important skill for humanists to develop.

In-person Meetings Can Take Many Forms

When we met, Eric and I did a lot of different things. First, we would talk through my questions from the previous week. If I felt a particular section of code was clunky or poorly done, he would talk and walk me through rewriting the same piece in a more elegant form. We would often pair program, where Eric would write code while I watched, carefully stopping him each time I had a question about something he was doing. And we often took time to reflect on where the collaboration was going – what my end goal was as well as what my tasks before the next meeting would be. Any project has many pieces that could be dealt with at any time, and Eric was careful to give me solo tasks that he felt I could handle on my own, reserving more difficult tasks for times in which we would be able to work together. All of this is to say that any single hour we spent together was very different from the last. We constantly reinvented what the meetings looked like, which kept them fresh and pedagogically effective.

This is my best attempt to recreate my experience of working in such a close mentoring relationship with Eric. Obviously, the collaboration relies on an extremely low student-to-teacher ratio: I can imagine this same approach working very well for a handful of students, but this work required a lot of individual attention that would be hard to sustain for larger classes. One idea for scaling the process up might be to divide a course into groups, being training one, and then have students later in the process begin to mentor those who are just beginning. Doing so would preserve what I see as the main advantage of this approach: it helps to collapse the hierarchy between student and teacher and engage both in a common project. Learning takes place, but it does so in the context of common effort. I’d have to think more about how this mentorship model could be adapted to fit different scenarios. The work with Eric is ongoing, but it’s already been one of the most valuable learning experiences I have had.

Categories
Incentive Grants Pedagogy

Genelle Gertz on “Gaming Paradise Lost

Please enjoy this post by Genelle Gertz, Associate Professor of English and Writing Program Director, on her experience using Ivanhoe in a course on Milton. Gertz received a DH Incentive Grant in 2014.

If you haven’t noticed lately, kids from five to twenty-five eat, breathe and sleep video games. Hoping to tap this audience, I took my first stab at merging the epic world of Paradise Lost with gaming culture. Ultimately, I plan to create a video game version of Milton’s cosmic epic, replete with angels, Paradise, the creation of Earth and the perilous seas of Chaos slamming the shores of Hell. But envisioning the world of Paradise Lost is only one part of game design: there’s also . . . the game. This I knew less about, not being a gamer. But there’s a large field of game studies with fascinating research, not only on the psychological benefits of games (Jane McGonigal’s just-published SuperBetter), but narrative theory about how games differ (or not) from fiction (Henry Jenkins; Marie-Laure Ryan). So I cleared portions of my upper-level English syllabus on Milton to make room for game studies, and my trusty DH colleague, Jeff Barry, suggested I use the newly-improved Scholar’s Lab program, Ivanhoe, to start the first version of “Gaming Paradise Lost.”

Ivanhoe, so named because the first version explored Walter Scott’s novel, analyzes plot, characterization and structure within a literary text by rendering it as a game. The program emerged in the very early stages of DH development in the 1980s, and facilitated role-playing through email exchanges about the text. The most recent version of the program works on a WordPress platform and requires students to create a role, including developing a bio and picture, and then responding within this role to a series of “moves.” Videos and sound can be uploaded to accompany any move.

I required students to post once a week to our WordPress site in their chosen roles. Jeff Barry came to the class and explained how to use the game, leaving us with helpful framing questions to influence the first set of “moves,” or “responses.” No student identities were revealed until the end of the course, so we had fun guessing who was masterminding posts by Beelzebub, Azazel-Fallen Cherub #112, William Shakespeare, Marilynne Robinson, or the seventeenth-century “contemporary” to Milton, Whom-He-Predestinate-Thrunce. Role-playing afforded the students creative license as well as the opportunity to think collaboratively, both features touted in game science as psychologically beneficial parts of gaming. In their roles, students approached the great critical questions of the text, such as whether or not Satan is heroic, God is just, and Eve is anything other than screwed.

We played Ivanhoe for the six weeks in which we read Paradise Lost, and what became apparent is that Ivanhoe encourages creativity and collaboration, but needs more structure. Other than responding from a particular role to aspects of Paradise Lost, students needed clear objectives and rules. Veteran class bloggers and textual interpreters, these students reproduced what they already do well: critique the text. Ivanhoe was to them a blog wrapped in game’s clothing. Now that I’ve been through it once, I know that I will have to set up clearer objectives and list some preliminary roles, keeping students within the world of Paradise Lost. I will give them a way of tracking progress in the game too.

Assessing gameplay, not just in terms of grading, but also in terms of promoting student reflection, poses challenges. I required final presentations on Ivanhoe that analyzed the posts/moves of assigned characters. In this way, each “role” came under scrutiny in terms of its overall meaning and contribution. Some students were more diplomatic than others when it came to leveling criticism, and some analyses were more fanciful than probing. I’d like to switch the final presentation to one in which students work collaboratively to create new games in board form. They would develop their game version for Paradise Lost, demonstrate it for the class, and explain its relevance to game studies and/or the epic. After we read several articles on game studies, it became clear that board games are a physical way of working out design of game concepts, and that we could put more planning into how to build a game as a precursor for developing a video game.

Playing Ivanhoe also raises questions about how games aid our knowledge of primary texts. One preliminary idea is that Milton’s epic denounces the classical literary values of the epic hero, elevating personal sacrifice over battle bravery. We know that video games, just like the ancient epics, frequently require violence. So how can we build a game in keeping with Milton’s text, one that fosters a different kind of heroic ethos? I’ll be working on that for “Gaming Paradise Lost 2.0,” and I hope, by then, to have more students helping me with the technical side of building a virtual, visual world of Paradise Lost.

Categories
Pedagogy Tools

TimelineJS & the British Reformations

Students in a British history course recently completed an extensive timeline of the British Reformations in context. Professor Michelle Brock structured the project as an assignment that amounted to 15% of the course grade. The timeline also serves as a resource for students writing their final essays for the course. This approach to DH emphasizes that digital projects are not simply end products but also can inform written works.

Screenshot of British Reformations in Context timeline

TimelineJS was chosen by Brock as the appropriate tool for this project due to its visual capabilities. Prior to the beginning of the term, Brock consulted with the DHAT to plan how to instruct students on using this tool to contextualize the British Reformations. An essential feature was the tag functionality of TimelineJS to indicate whether an event occured in the English Reformation, Scottish Reformation, or the Continental European Reformation. Brock describes the goal of the assignment:

“The goal of this three-tiered timeline is to give student a visual overview of the trajectory of the European, English, and Scottish Reformations, and a more tangible representation of the relationship between the three. This should also provide a deeper understanding of the English and Scottish Reformations in their European contexts, as well as an illustration of their respective local and national dimensions. Students will then use this timeline to help write their final essay.”

Students worked in three groups of four to populate the spreadsheet that powers the timeline. Students were responsible for identifying and entering key events, documents, and people for their respective Reformation (a period spanning between 1450 – 1650). Each entry had to include a brief descriptive paragraph (80 – 120 words) explaining the significance of the topic. Students were encouraged to include images where appropriate. And, if applicable, students could include links to video on YouTube.

Each member of the group was expected to contribute 7 – 10 entries. Groups were expected to work collaboratively over the course of the semester. A librarian provided initial training to the class on January 19. The students completed their work on March 30. In addition, all the students had to turn in an individual timeline report that specified which entries they wrote and the list of sources used to write those entries.

The final timeline has 73 entries about the Reformations.

Interested in using TimelineJS in your couse? See our introduction to TimelineJS.

Categories
DH Pedagogy

TimelineJS & the British Reformations

Students in a British history course recently completed an extensive timeline of the British Reformations in context. Professor Michelle Brock structured the project as an assignment that amounted to 15% of the course grade. The timeline also serves as a resource for students writing their final essays for the course. This approach to DH emphasizes that digital projects are not simply end products but also can inform written works.

Screenshot of British Reformations in Context timeline

TimelineJS was chosen by Brock as the appropriate tool for this project due to its visual capabilities. Prior to the beginning of the term, Brock consulted with the DHAT to plan how to instruct students on using this tool to contextualize the British Reformations. An essential feature was the tag functionality of TimelineJS to indicate whether an event occured in the English Reformation, Scottish Reformation, or the Continental European Reformation. Brock describes the goal of the assignment:

“The goal of this three-tiered timeline is to give student a visual overview of the trajectory of the European, English, and Scottish Reformations, and a more tangible representation of the relationship between the three. This should also provide a deeper understanding of the English and Scottish Reformations in their European contexts, as well as an illustration of their respective local and national dimensions. Students will then use this timeline to help write their final essay.”

Students worked in three groups of four to populate the spreadsheet that powers the timeline. Students were responsible for identifying and entering key events, documents, and people for their respective Reformation (a period spanning between 1450 – 1650). Each entry had to include a brief descriptive paragraph (80 – 120 words) explaining the significance of the topic. Students were encouraged to include images where appropriate. And, if applicable, students could include links to video on YouTube.

Each member of the group was expected to contribute 7 – 10 entries. Groups were expected to work collaboratively over the course of the semester. A librarian provided initial training to the class on January 19. The students completed their work on March 30. In addition, all the students had to turn in an individual timeline report that specified which entries they wrote and the list of sources used to write those entries.

The final timeline has 73 entries about the Reformations.

Interested in using TimelineJS in your couse? See our introduction to TimelineJS.

Categories
DH Incentive Grants Pedagogy Project Update Tools

Raw Density & early Islamic law

Professor Joel Blecher received a DH Incentive grant from W&L for the course History of Islamic Civilization I: Origins to 1500. A pedagogical DH component of that course is for students to produce a set of visualizations of data that they have collected about the transmission of early Islamic law. The students will be using two tools for the visualizations: Palladio and Raw Density.

In this post we’ll examine the use of Raw Density. Separate posts will explore the use of Palladio and the data collection process. This post will provide one example of a data visualization of early Islamic law.

 Raw Density

Raw Density is a Web app offering a simple way to generate visualizations from tabular data, e.g., spreadsheets or delimiter-separated values. Getting started with Raw is deceptively simple: just upload your data.

The complicated part is deciding which of the sixteen visuals is best for your data. While an entire course could be taught on data visualizations, the purpose within this course is for the students to develop familiarity with visualizing historical data. Not all types of charts are appropriate for every type of data.

Our sample diagram uses the first option in Raw Density, which is what the creators behind Raw Density call an “Alluvial diagram (Fineo-like)”. (Fineo was a former research project by Density Design, the developers of Raw Density.) We’re using this type of diagram to show relationships among different types of categories.

Transmitters of early Islamic law

This diagram is based on 452 transmitters of early Islamic law. A transmitter is classified either as a companion or a follower. A companion is one who encountered Muhammad in his lifetime. A follower is one who lived in the generation after Muhammad’s death.

alluvialtransmittersStatusConverted

The data collected consists of 17 fields but for the purpose of this diagram we used only 4 categories: gender, transmitterStatus, Converted (Yes/No), priorRelgion. When the transmitterStatus was unknown then the transmitter was grouped into either other or undetermined.

In the diagram you can see how the colored ribbons visualize the data flow from the general category of gender to the more specific categories. The right-side of the diagram divides the transmitters into those that had converted from a prior religion (marked as ‘Yes’) and those that did not (marked as ‘No’).

Visualization allows for a clearer understanding of the data than is possible through a simple examination of tabular content in a spreadsheet. Visualization makes it easy to spot data collecting errors. For example, is there a distinction in the transmitterStatus field between Other and Undetermined or could we have collapsed that into a single field in our data collection form? Also, the visualization identifies where further research is needed, e.g., other data sources should provide details about whether the transmitters with undetermined/other status were companions or followers.

The students in this course will produce various visualizations using Raw Density.

Categories
DH Incentive Grants Pedagogy Research Projects Tools

Raw Density & early Islamic law

Professor Joel Blecher received a DH Incentive grant from W&L for the course History of Islamic Civilization I: Origins to 1500. A pedagogical DH component of that course is for students to produce a set of visualizations of data that they have collected about the transmission of early Islamic law. The students will be using two tools for the visualizations: Palladio and Raw Density.

In this post we’ll examine the use of Raw Density. Separate posts will explore the use of Palladio and the data collection process. This post will provide one example of a data visualization of early Islamic law.

 Raw Density

Raw Density is a Web app offering a simple way to generate visualizations from tabular data, e.g., spreadsheets or delimiter-separated values. Getting started with Raw is deceptively simple: just upload your data.

The complicated part is deciding which of the sixteen visuals is best for your data. While an entire course could be taught on data visualizations, the purpose within this course is for the students to develop familiarity with visualizing historical data. Not all types of charts are appropriate for every type of data.

Our sample diagram uses the first option in Raw Density, which is what the creators behind Raw Density call an “Alluvial diagram (Fineo-like)”. (Fineo was a former research project by Density Design, the developers of Raw Density.) We’re using this type of diagram to show relationships among different types of categories.

Transmitters of early Islamic law

This diagram is based on 452 transmitters of early Islamic law. A transmitter is classified either as a companion or a follower. A companion is one who encountered Muhammad in his lifetime. A follower is one who lived in the generation after Muhammad’s death.

alluvialtransmittersStatusConverted

The data collected consists of 17 fields but for the purpose of this diagram we used only 4 categories: gender, transmitterStatus, Converted (Yes/No), priorRelgion. When the transmitterStatus was unknown then the transmitter was grouped into either other or undetermined.

In the diagram you can see how the colored ribbons visualize the data flow from the general category of gender to the more specific categories. The right-side of the diagram divides the transmitters into those that had converted from a prior religion (marked as ‘Yes’) and those that did not (marked as ‘No’).

Visualization allows for a clearer understanding of the data than is possible through a simple examination of tabular content in a spreadsheet. Visualization makes it easy to spot data collecting errors. For example, is there a distinction in the transmitterStatus field between Other and Undetermined or could we have collapsed that into a single field in our data collection form? Also, the visualization identifies where further research is needed, e.g., other data sources should provide details about whether the transmitters with undetermined/other status were companions or followers.

The students in this course will produce various visualizations using Raw Density.

Categories
Pedagogy

Case study in DH at a liberal arts college

If you’re wondering how DH got started at W&L and what’s been happening here over the last couple of years with DH, then you’ll want to read Launching the Digital Humanities Movement at Washington and Lee University: A Case Study.

Here’s an excerpt:

Improving student learning, however, first requires defining the learning outcomes expected through DH. One can find an excellent set of learning outcomes and priorities in Digital_Humanities emphasizing “the ability to think critically with digital methods to formulate projects that have humanities questions at their core” (Burdick et al. 2012, 134). Indeed, the mode of critical thinking with digital methods must be incorporated within the mindset of faculty, IT professionals, and librarians to effectively teach with the digital humanities.

Such thinking is the key to the future of digital humanities on this campus. Dean Keen offers an energetic vision:

In ten years, digital humanities projects will be so diffused throughout the curriculum that they no longer look experimental; they gain broad acceptance as a legitimate mode of student work. Student transcripts contain links to their DH projects as part of demonstrated student learning outcomes. Our liberal arts grads possess not only information fluency, but the craft skills to make and manipulate digital artifacts. Parsing large data sets in easily visualized and nuanced ways becomes a normal skill of our humanities grads, along with writing and critical thinking (Suzanne Keen, e-mail message to author, March 11, 2014).

The key for success of the digital humanities at a small liberal arts college is to focus on the learning outcomes. Identify the knowledge and skills that students should acquire through the DH assignments in a course, and think deeply about how students can transfer that digital learning to their other courses and their lives beyond graduation. In the end, the value of the digital humanities is to reinforce the critical thinking and lifelong learning skills that are the foundation of a liberal arts education.

Categories
Incentive Grants Pedagogy

DH Pedagogy Incentive Grant Winners

The Digital Humanities Working Group was inspired by the number, variety, depth, and breadth of the submissions to the incentive grant proposals.  The group had a lively discussion about the relative merits and impact of all the proposals.  In the end, we chose the following awardees:

  • Hank Dobin, ENGL 292: Representing Queen Elizabeth
  • Sascha Goluboff, ANTH 290: Campus Sex in the Digital Age
  • Wan-Chuan Kao, ENGL 382: Hotel Orient
  • Howard Pickett, Poverty 102: Field Work in Poverty Studies

We look forwarding to hearing about the awardees’ and their students’ experiences in these courses.  The awardees will be presenting their DH course projects–challenges, successes, failures, and lessons learned–in a Fall 2014 Faculty Academy session.