Professor Joel Blecher received a DH Incentive grant from W&L for the course History of Islamic Civilization I: Origins to 1500. A pedagogical DH component of that course is for students to produce a set of visualizations of data that they have collected about the transmission of early Islamic law. The students will be using two tools for the visualizations: Palladio and Raw Density.
In this post we’ll examine the use of Raw Density. Separate posts will explore the use of Palladio and the data collection process. This post will provide one example of a data visualization of early Islamic law.
Raw Density
Raw Density is a Web app offering a simple way to generate visualizations from tabular data, e.g., spreadsheets or delimiter-separated values. Getting started with Raw is deceptively simple: just upload your data.
The complicated part is deciding which of the sixteen visuals is best for your data. While an entire course could be taught on data visualizations, the purpose within this course is for the students to develop familiarity with visualizing historical data. Not all types of charts are appropriate for every type of data.
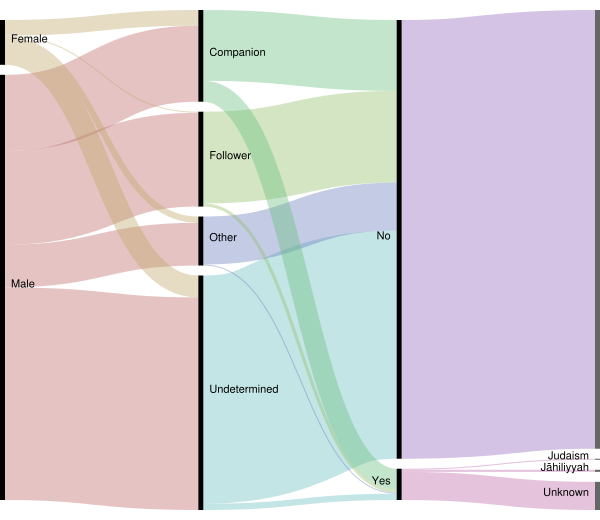
Our sample diagram uses the first option in Raw Density, which is what the creators behind Raw Density call an “Alluvial diagram (Fineo-like)”. (Fineo was a former research project by Density Design, the developers of Raw Density.) We’re using this type of diagram to show relationships among different types of categories.
Transmitters of early Islamic law
This diagram is based on 452 transmitters of early Islamic law. A transmitter is classified either as a companion or a follower. A companion is one who encountered Muhammad in his lifetime. A follower is one who lived in the generation after Muhammad’s death.

The data collected consists of 17 fields but for the purpose of this diagram we used only 4 categories: gender, transmitterStatus, Converted (Yes/No), priorRelgion. When the transmitterStatus was unknown then the transmitter was grouped into either other or undetermined.
In the diagram you can see how the colored ribbons visualize the data flow from the general category of gender to the more specific categories. The right-side of the diagram divides the transmitters into those that had converted from a prior religion (marked as ‘Yes’) and those that did not (marked as ‘No’).
Visualization allows for a clearer understanding of the data than is possible through a simple examination of tabular content in a spreadsheet. Visualization makes it easy to spot data collecting errors. For example, is there a distinction in the transmitterStatus field between Other and Undetermined or could we have collapsed that into a single field in our data collection form? Also, the visualization identifies where further research is needed, e.g., other data sources should provide details about whether the transmitters with undetermined/other status were companions or followers.
The students in this course will produce various visualizations using Raw Density.